Our tools Publications Privacy policy Contact us

Motivation

    In our lab, we regularly find ourselves looking up various somatic mutations in the context of human cancers and retreive their frequency of occurance in human cancer samples. Therefore, we made this simple tool and dubbed it "DORM". We process the COSMIC data releases and present our processed database here which display the statistics about recurrent cancer-associated mutations that are identified from genome-wide screens (i.e., a mutation e.g. KRAS G12C, is listed in DORM if it has a tissue-agnostic population frequency > 1 ).

Our Goal

    We aimed at developing a fast and lightweight web-tool to give a quick-and-easy peek into COSMIC dataset so a user can check if their particular mutation or mutations in their favorite protein(s) is common or rare occurence in cancer samples.


About the database

    DORM is made available in two variants to answer two related, but slightly different questions. The user can also browse or restrict the search space to 38 tissue types e.g. pancreas, skin, lung, etc.

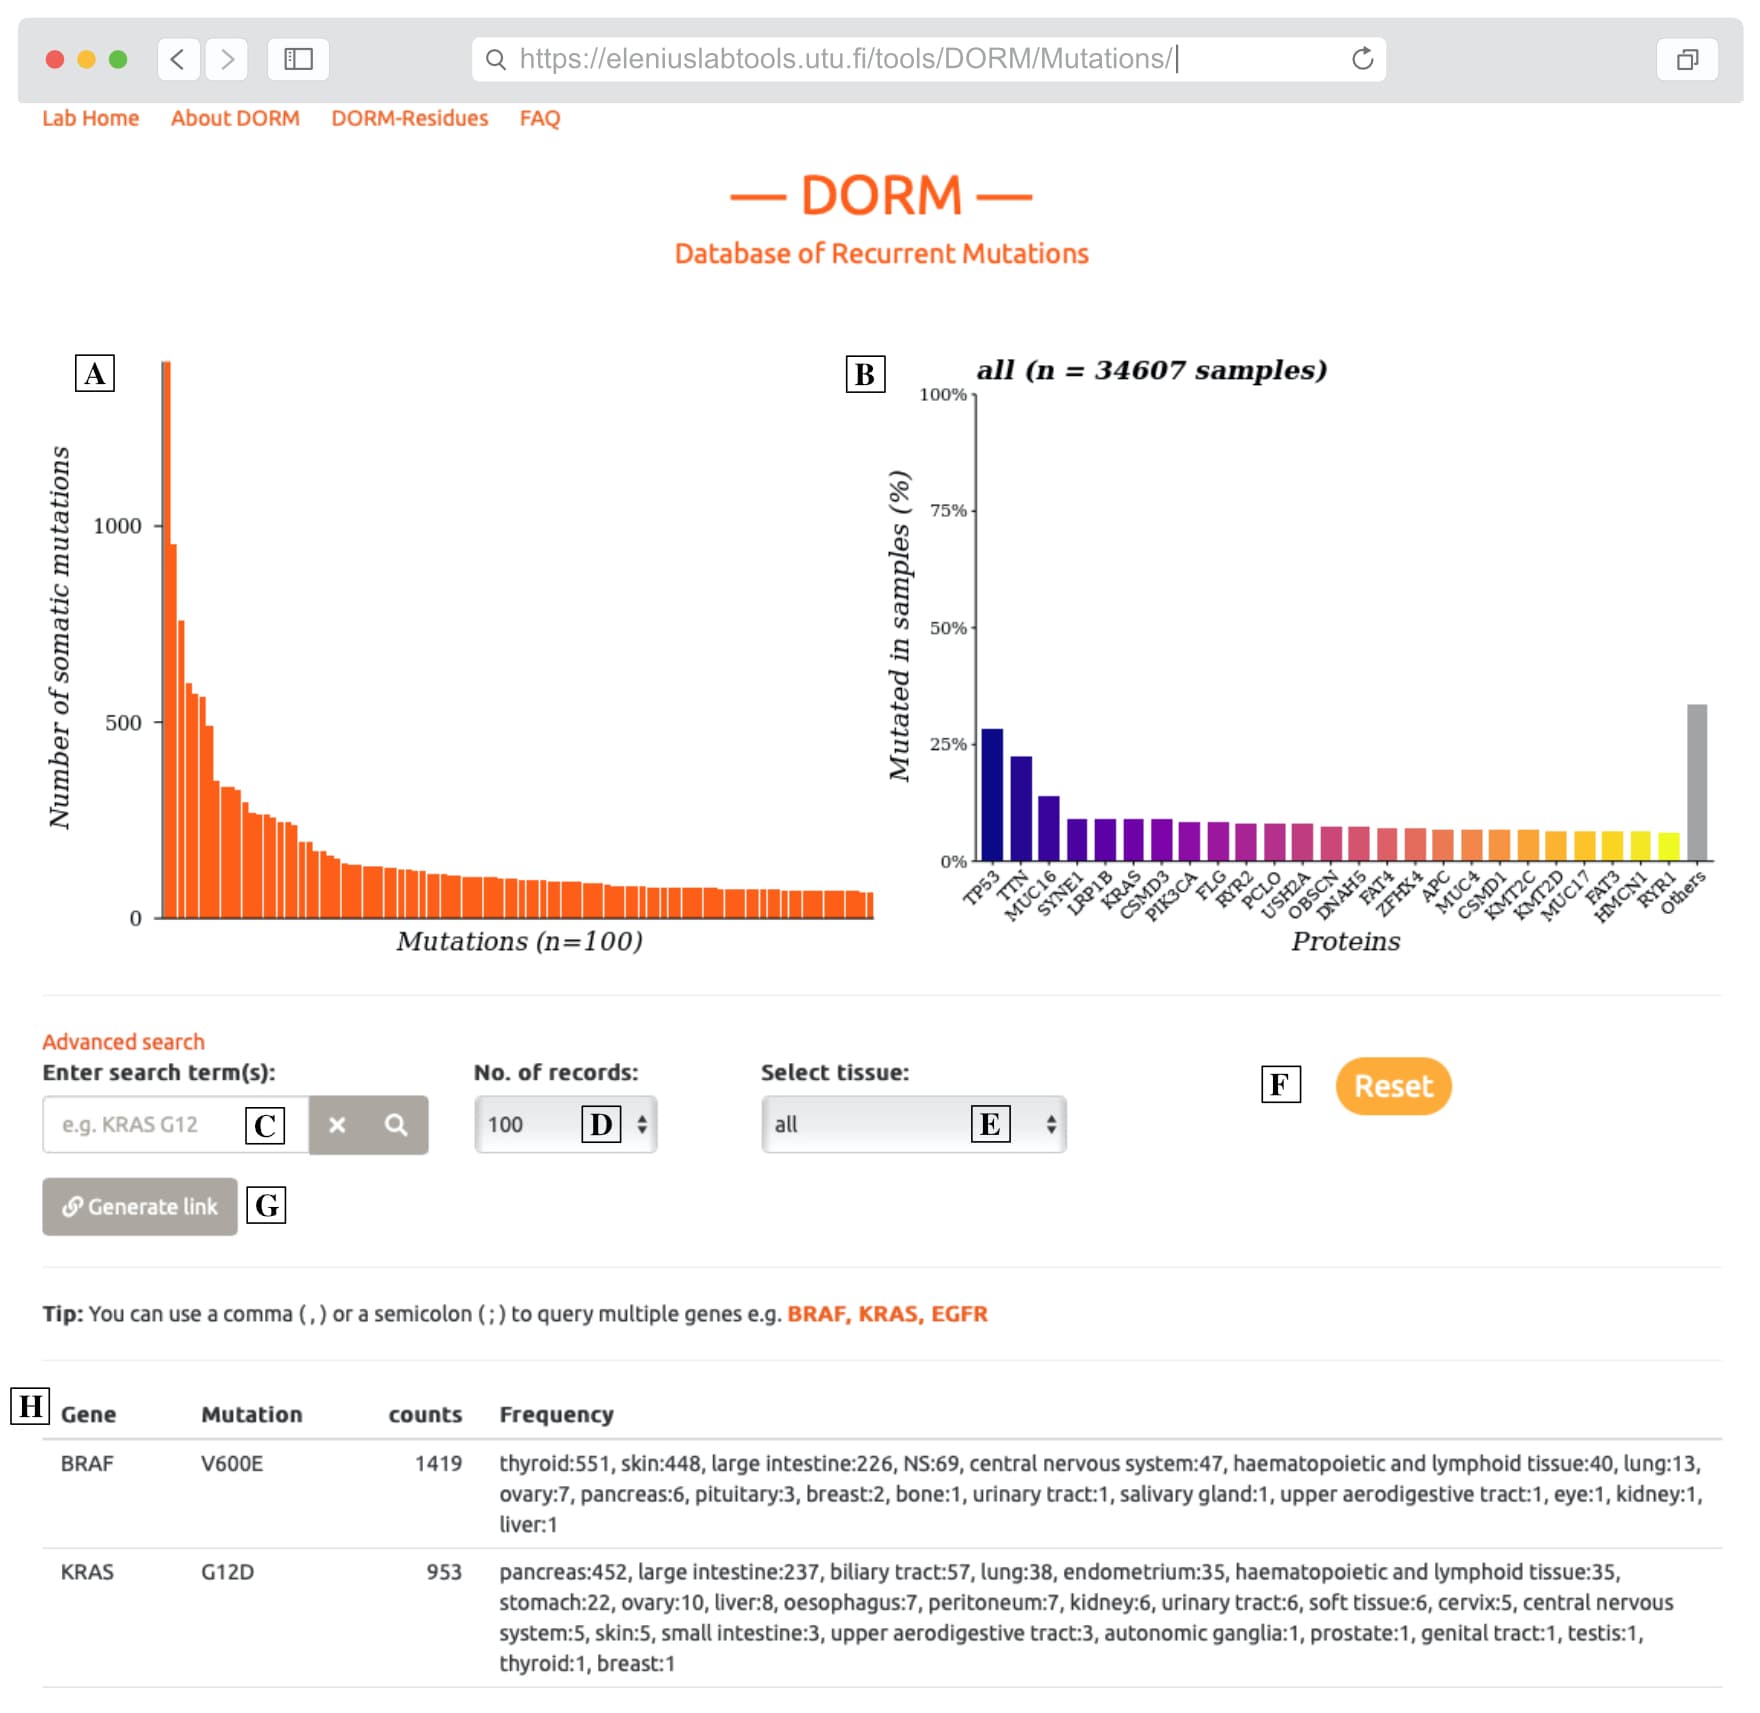
    1. Individual Mutations

    Here you can find the frequency of the recurrent mutations listed as exact amino acid changes. You can explore the the database with search terms like: 'EGFR, KRAS, BRAF' , 'EGFR L858R' , and even perform advanced searches using regular expressions.


    2. Grouped by Residue

    This database lists the frequency of the recurrent mutations grouped by amino acid residues e.g. KRAS G12C/V/D are all grouped as KRAS G12. You can explore the the database with search terms like: 'EGFR, KRAS, BRAF' , 'KRAS Q' , and even perform advanced searches using regular expressions.


How to use the database?

Screenshot of the database UI

The picture above is from the DORM user interface for recurrent mutations, and you get the same layout while browsing amino acid residues. Here is a brief description of the UI-elements marked in the picture:

A) A dynamically-generated bar graph of the recurrent mutations (displayed in table 'F'), sorted in descending order of their frequency in the population (selected tissue in 'E'). The plot summarizes the records.
B) A bar graph showing the samples (as % of total) with mutations in the top 25 most-frequently mutated proteins (for the selected tissue in 'E'). This plot always includes all the samples (for the selected tissue) and shows the sample size (n) at the top of the plot.
C) Search box to enter your search queries. Use a comma or a semicolon for separating protein names (e.g. "BRAF, KRAS") and a space to separate protein-mutation pair e.g. "KRAS G12C". You can use regular expressions for performing advanced queries. The search query can be reset by clicking the button marked with “x”. Doing this instead of clicking the “Reset” button, retains other parameters e.g. selected number of rows and tissue.
D) Select the number of records you want to be displayed in the table ‘F’ and the bar chart ‘A’. The maximum number of entries is limited to 10,000 to reduce load on our server. If you need a bigger limit, please get in touch with us via our Issue Tracker.
E) Select your target tissue. Select “all” for pan-cancer analysis, and any tissue, e.g. “pancreas” for limiting the search to that tissue type.
F) Reset button to reset all the set parameters and search query.
G) Button to generate a direct link to conduct a search with the exact the search terms and parameters. Very useful for sharing with colleagues & record-keeping.
H) Table of records from our database showing the Protein, the mutation, the number of samples harboring that mutation and in case of pan-cancer analysis (i.e. ‘all’ is the selected tissue), a breakdown of the frequency by tissue type.


  • Note: For further in-depth investigation we recommend to head over to COSMIC or cBioPortal.

  • Last modified on December 16, 2021.